The EIAapi package provides functions to query and pull tidy data from EIA API v2.
Introduction to the EIAapi package available here.
Requirments
To pull data from the API using this package, you will need the following:
- jq - The package uses jq to parse the API output from JSON to tabular format. To download and install jq follow the instructions on the download page.
- API key - To query the EIA API, you will need to register to the service to receive the API key.
To register to to the API go to https://www.eia.gov/opendata/ and click the
Register button, and follow the instruction.
Installation
Install the stable version from [CRAN]:
install.packages("EIAapi")Or, install the development version from Github:
# install.packages("devtools")
devtools::install_github("RamiKrispin/EIAapi")
Query data
A suggested workflow to query data from the EIA API with the
eia_get function:
- Go to the EIA API Dashboard website
- Select the API Route and define filters
- Submit the query and extract the query information from the query
metadata:
- API URL
- Header

In the example above:
- The API URL:
https://api.eia.gov/v2/electricity/rto/fuel-type-data/data/, and - The query header:
{
    "frequency": "hourly",
    "data": [
        "value"
    ],
    "facets": {},
    "start": null,
    "end": null,
    "sort": [
        {
            "column": "period",
            "direction": "desc"
        }
    ],
    "offset": 0,
    "length": 5000,
    "api-version": "2.0.3"
}
Using the URL and header information, we can submit the GET request
with the eia_get function:
library(EIAapi)

# Pulling the API key from my renviron file
api_key <- Sys.getenv("eia_key")

df1 <- eia_get(
  api_key = api_key,
  api_path = "electricity/rto/fuel-type-data/data/",
  data = "value"
)

nrow(df1)
#> [1] 5000

head(df1)
#>          period respondent                       respondent-name fueltype
#> 1 2019-09-02T06        FPC             Duke Energy Florida, Inc.      SUN
#> 2 2019-09-03T04       PSEI              Puget Sound Energy, Inc.      WAT
#> 3 2019-09-02T11       MIDA                          Mid-Atlantic       NG
#> 4 2019-09-02T18         NW                             Northwest      OTH
#> 5 2019-09-02T21       AECI Associated Electric Cooperative, Inc.       NG
#> 6 2019-09-02T12       CENT                               Central      NUC
#>     type-name value   value-units
#> 1       Solar     0 megawatthours
#> 2       Hydro   497 megawatthours
#> 3 Natural gas 24868 megawatthours
#> 4       Other   795 megawatthours
#> 5 Natural gas  1551 megawatthours
#> 6     Nuclear  2001 megawatthours
Note: The api_path argument defines by
the query of the path that following the endpoint of the API -
https://api.eia.gov/v2/. In the example above the API full
URL is:
Therefore, the query’s path is set to
electricity/rto/fuel-type-data/data/.
The eia_get function leverages the jq tool to parse the return
JSON object from the API into CSV format and the data.table
package to read and parse the object into R. By default, the function
returns a data.frame object, but you can use the
format argument and set the output object as
data.table:
df2 <- eia_get(
  api_key = api_key,
  api_path = "electricity/rto/fuel-type-data/data/",
  data = "value",
  format = "data.table"
)

df2
#>              period respondent                         respondent-name fueltype
#>    1: 2019-09-02T06        FPC               Duke Energy Florida, Inc.      SUN
#>    2: 2019-09-03T04       PSEI                Puget Sound Energy, Inc.      WAT
#>    3: 2019-09-02T11       MIDA                            Mid-Atlantic       NG
#>    4: 2019-09-02T18         NW                               Northwest      OTH
#>    5: 2019-09-02T21       AECI   Associated Electric Cooperative, Inc.       NG
#>   ---
#> 4996: 2019-09-01T15        HST                       City of Homestead       NG
#> 4997: 2019-09-01T18        AEC           PowerSouth Energy Cooperative      WAT
#> 4998: 2019-09-01T17         SC South Carolina Public Service Authority       NG
#> 4999: 2019-09-02T04       PSEI                Puget Sound Energy, Inc.      WND
#> 5000: 2019-09-01T05        FPC               Duke Energy Florida, Inc.      OIL
#>         type-name value   value-units
#>    1:       Solar     0 megawatthours
#>    2:       Hydro   497 megawatthours
#>    3: Natural gas 24868 megawatthours
#>    4:       Other   795 megawatthours
#>    5: Natural gas  1551 megawatthours
#>   ---
#> 4996: Natural gas     0 megawatthours
#> 4997:       Hydro     0 megawatthours
#> 4998: Natural gas   780 megawatthours
#> 4999:        Wind   239 megawatthours
#> 5000:   Petroleum     0 megawatthours
If you wish to pull more than the length upper limit,
you can use the offset to offset the query by limit and
pull the next observations:
df3 <- eia_get(
  api_key = api_key,
  api_path = "electricity/rto/fuel-type-data/data/",
  data = "value",
  length = 5000,
  offset = 5000,
  format = "data.table"
)

df3
#>              period respondent                                respondent-name
#>    1: 2019-09-01T10        TAL                            City of Tallahassee
#>    2: 2019-09-01T23         SE                                      Southeast
#>    3: 2019-09-01T16       SWPP                           Southwest Power Pool
#>    4: 2019-09-01T09       PSCO             Public Service Company of Colorado
#>    5: 2019-09-01T23       CPLW                      Duke Energy Progress West
#>   ---
#> 4996: 2019-09-08T13       SCEG           Dominion Energy South Carolina, Inc.
#> 4997: 2019-09-09T02         SC        South Carolina Public Service Authority
#> 4998: 2019-09-09T03        YAD Alcoa Power Generating, Inc. - Yadkin Division
#> 4999: 2019-09-08T17       TIDC                    Turlock Irrigation District
#> 5000: 2019-09-09T00         SE                                      Southeast
#>       fueltype   type-name value   value-units
#>    1:       NG Natural gas   277 megawatthours
#>    2:       NG Natural gas 21452 megawatthours
#>    3:      COL        Coal 13539 megawatthours
#>    4:      COL        Coal  1835 megawatthours
#>    5:      WAT       Hydro    32 megawatthours
#>   ---
#> 4996:      WAT       Hydro    15 megawatthours
#> 4997:      SUN       Solar     2 megawatthours
#> 4998:      WAT       Hydro     1 megawatthours
#> 4999:       NG Natural gas   193 megawatthours
#> 5000:      OIL   Petroleum     0 megawatthours
You can narrow down your pull by using the facets
argument and applying some filters. For example, in the example above,
let’s filter data by the fuletype field and select energy
source as Natural gas (NG) and the region as
United States Lower 48 (US48), and then extract the
header:
{
    "frequency": "hourly",
    "data": [
        "value"
    ],
    "facets": {
        "respondent": [
            "US48"
        ],
        "fueltype": [
            "NG"
        ]
    },
    "start": null,
    "end": null,
    "sort": [
        {
            "column": "period",
            "direction": "desc"
        }
    ],
    "offset": 0,
    "length": 5000,
    "api-version": "2.0.3"
}
Updating the query with the facets information:
facets <- list(respondent = "US48", fueltype = "NG")

df4 <- eia_get(
  api_key = api_key,
  api_path = "electricity/rto/fuel-type-data/data/",
  data = "value",
  length = 5000,
  format = "data.table",
  facets = facets
)

df4
#>              period respondent        respondent-name fueltype   type-name
#>    1: 2019-09-03T02       US48 United States Lower 48       NG Natural gas
#>    2: 2019-09-02T08       US48 United States Lower 48       NG Natural gas
#>    3: 2019-09-02T06       US48 United States Lower 48       NG Natural gas
#>    4: 2019-09-03T03       US48 United States Lower 48       NG Natural gas
#>    5: 2019-09-02T16       US48 United States Lower 48       NG Natural gas
#>   ---
#> 4996: 2018-11-09T20       US48 United States Lower 48       NG Natural gas
#> 4997: 2018-11-09T21       US48 United States Lower 48       NG Natural gas
#> 4998: 2018-11-07T11       US48 United States Lower 48       NG Natural gas
#> 4999: 2018-11-07T12       US48 United States Lower 48       NG Natural gas
#> 5000: 2018-11-07T13       US48 United States Lower 48       NG Natural gas
#>        value   value-units
#>    1: 238622 megawatthours
#>    2: 149180 megawatthours
#>    3: 164671 megawatthours
#>    4: 217190 megawatthours
#>    5: 206225 megawatthours
#>   ---
#> 4996: 145412 megawatthours
#> 4997: 147572 megawatthours
#> 4998: 109269 megawatthours
#> 4999: 123157 megawatthours
#> 5000: 132755 megawatthours

unique(df4$fueltype)
#> [1] "NG"
unique(df4$respondent)
#> [1] "US48"
Last but not least, you can set the starting and ending time of the query. For example, let’s set a window between June 1st and October 1st, 2022:
df5 <- eia_get(
  api_key = api_key,
  api_path = "electricity/rto/fuel-type-data/data/",
  data = "value",
  length = 5000,
  format = "data.table",
  facets = facets,
  start = "2022-06-01T00",
  end = "2022-10-01T00"
)

df5
#>              period respondent        respondent-name fueltype   type-name
#>    1: 2022-06-01T00       US48 United States Lower 48       NG Natural gas
#>    2: 2022-06-01T01       US48 United States Lower 48       NG Natural gas
#>    3: 2022-06-01T02       US48 United States Lower 48       NG Natural gas
#>    4: 2022-06-01T03       US48 United States Lower 48       NG Natural gas
#>    5: 2022-06-01T04       US48 United States Lower 48       NG Natural gas
#>   ---
#> 2925: 2022-09-30T20       US48 United States Lower 48       NG Natural gas
#> 2926: 2022-09-30T21       US48 United States Lower 48       NG Natural gas
#> 2927: 2022-09-30T22       US48 United States Lower 48       NG Natural gas
#> 2928: 2022-09-30T23       US48 United States Lower 48       NG Natural gas
#> 2929: 2022-10-01T00       US48 United States Lower 48       NG Natural gas
#>        value   value-units
#>    1: 247460 megawatthours
#>    2: 242340 megawatthours
#>    3: 233394 megawatthours
#>    4: 215728 megawatthours
#>    5: 183732 megawatthours
#>   ---
#> 2925: 186416 megawatthours
#> 2926: 190630 megawatthours
#> 2927: 196122 megawatthours
#> 2928: 198929 megawatthours
#> 2929: 200809 megawatthours

df5$time <- as.POSIXct(paste(substr(df5$period, start = 1, stop = 10)," ",
                       substr(df5$period, start = 12, stop = 13), ":00:00",
                       sep = ""))

plot(x = df5$time, y = df5$value,
     main = "United States Lower 48 Hourly Electricity Generation by Natural Gas",
     col.main = "#457b9d",
     col = "#073b4c",
     sub = "Source: Form EIA-930 Product: Hourly Electric Grid Monitor",
     xlab = "",
     ylab = "Megawatt Hours",
     cex.main=1,
     cex.lab=1,
     cex.sub=0.8,
     frame=FALSE,
     type = "l")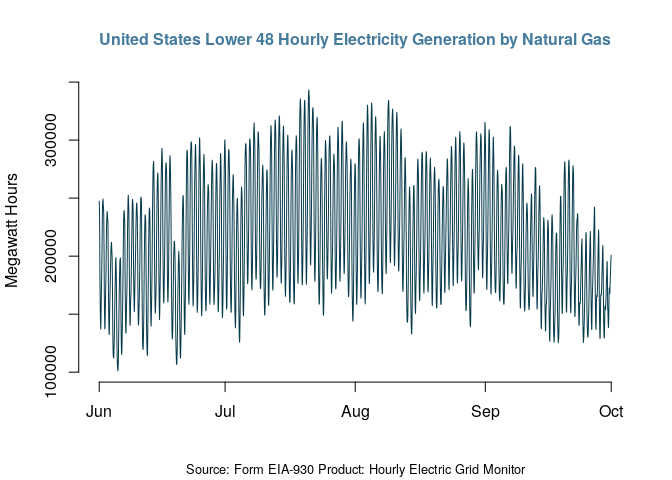
API Resources
- EIA API documentation: https://www.eia.gov/opendata/documentation.php
- EIA APIv2 Webinar: https://www.youtube.com/watch?v=1VsSp1XG-Pg&t=1671s&ab_channel=EIAgov