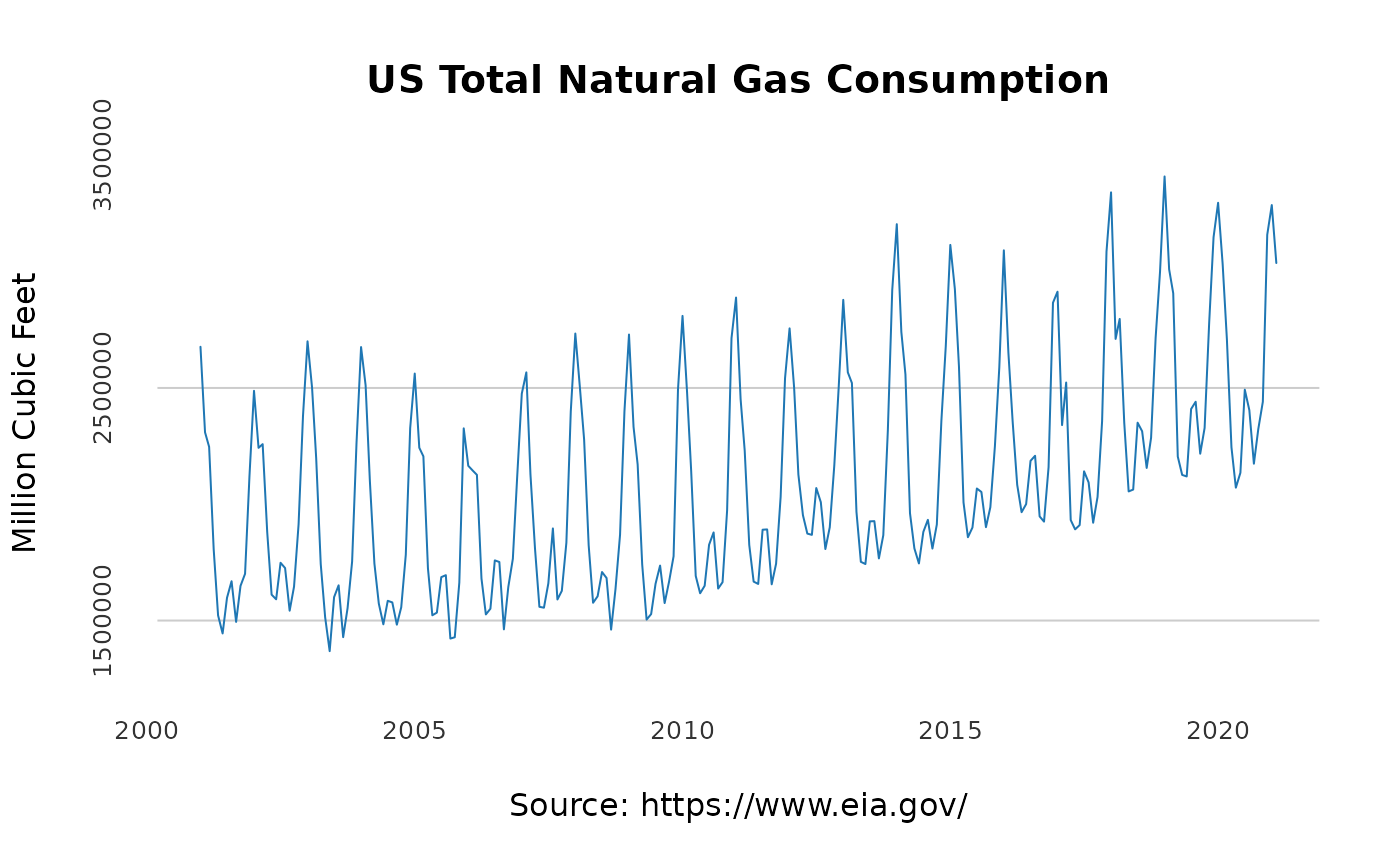
The dataset provides information about the total monthly natural gas consumption in the US between 2001 and 2020
Units: Million Cubic Feet
us_monthlyFormat
A data.frame with 2 variables.
- date
A Date, the month and year of the observation (the day set by default to 1st of the month)
- y
A numeric, the US monthly total natural gas consumption in a million cubic feet
Source
US Energy Information Administration (EIA) website.
Details
The dataset contains monthly summary of the total demand for natural gas in the US between 2001 and 2020.
Examples
data("us_monthly")

head(us_monthly)
#>         date       y
#> 1 2001-01-01 2676998
#> 2 2001-02-01 2309464
#> 3 2001-03-01 2246633
#> 4 2001-04-01 1807170
#> 5 2001-05-01 1522382
#> 6 2001-06-01 1444378

at_x <- seq.Date(from = as.Date("2000-01-01"),
                 to = as.Date("2020-01-01"),
                 by = "5 years")

at_y <- pretty(us_monthly$y)[c(2, 4, 6)]

plot(us_monthly$date, us_monthly$y,
     col = "#1f77b4",
     type = "l",
     frame.plot = FALSE,
     axes = FALSE,
     panel.first = abline(h = at_y, col = "grey80"),
     main = "US Total Natural Gas Consumption",
     xlab = "Source: https://www.eia.gov/",
     ylab = "Million Cubic Feet")


mtext(side =1, text = format(at_x, format = "%Y"), at = at_x,
      col = "grey20", line = 1, cex = 0.8)

mtext(side =2, text = format(at_y, scientific = FALSE), at = at_y,
      col = "grey20", line = 1, cex = 0.8)