Medical provider confirmed COVID-19 cases and confirmed COVID-19 related deaths in San Francisco, CA aggregated by several different geographic areas and normalized by 2018 American Community Survey (ACS) 5-year estimates for population data to calculate rate per 10,000 residents. More information about the data available here
covid19sf_geoFormat
An object class sf and data.frame with 8 variables.
- area_type
Area type, c("ZCTA", "Analysis Neighborhood", "Census Tract", "Citywide")
- id
area id
- count
The count of cases in the area
- rate
The rate of cases in the area, calculated as (count/acs_population) * 10000 which is a rate per 10,000 residents
- deaths
The number of cases in the area
- acs_population
The population from the latest 5-year estimates from the American Community Survey (2014-2018))
- last_updated
Last update of the data in POSIXc format)
- geometry
The area polygon data)
Source
San Francisco, Department of Public Health - Population Health Division through San Francisco Opne Data protal website.
Details
The dataset contains a summary of covid19 cases in San Francisco by geographic area
Examples
data(covid19sf_geo)
head(covid19sf_geo)
#> Simple feature collection with 6 features and 7 fields
#> Geometry type: MULTIPOLYGON
#> Dimension: XY
#> Bounding box: xmin: -122.4543 ymin: 37.70792 xmax: -122.357 ymax: 37.80602
#> Geodetic CRS: WGS 84
#> area_type id count rate deaths
#> 1 Analysis Neighborhood Bayview Hunters Point 5314 1401.4822 37
#> 2 Analysis Neighborhood Bernal Heights 1729 687.0108 NA
#> 3 Analysis Neighborhood Castro/Upper Market 1211 538.1744 15
#> 4 Analysis Neighborhood Chinatown 561 388.5580 17
#> 5 Analysis Neighborhood Excelsior 3347 839.2888 27
#> 6 Analysis Neighborhood Financial District/South Beach 1309 607.7912 NA
#> acs_population last_updated geometry
#> 1 37917 2021-12-14 08:30:14 MULTIPOLYGON (((-122.3936 3...
#> 2 25167 2021-12-14 08:30:14 MULTIPOLYGON (((-122.4036 3...
#> 3 22502 2021-12-14 08:30:14 MULTIPOLYGON (((-122.4266 3...
#> 4 14438 2021-12-14 08:30:14 MULTIPOLYGON (((-122.4062 3...
#> 5 39879 2021-12-14 08:30:14 MULTIPOLYGON (((-122.425 37...
#> 6 21537 2021-12-14 08:30:14 MULTIPOLYGON (((-122.3875 3...
library(sf)
#> Linking to GEOS 3.8.1, GDAL 3.2.1, PROJ 7.2.1
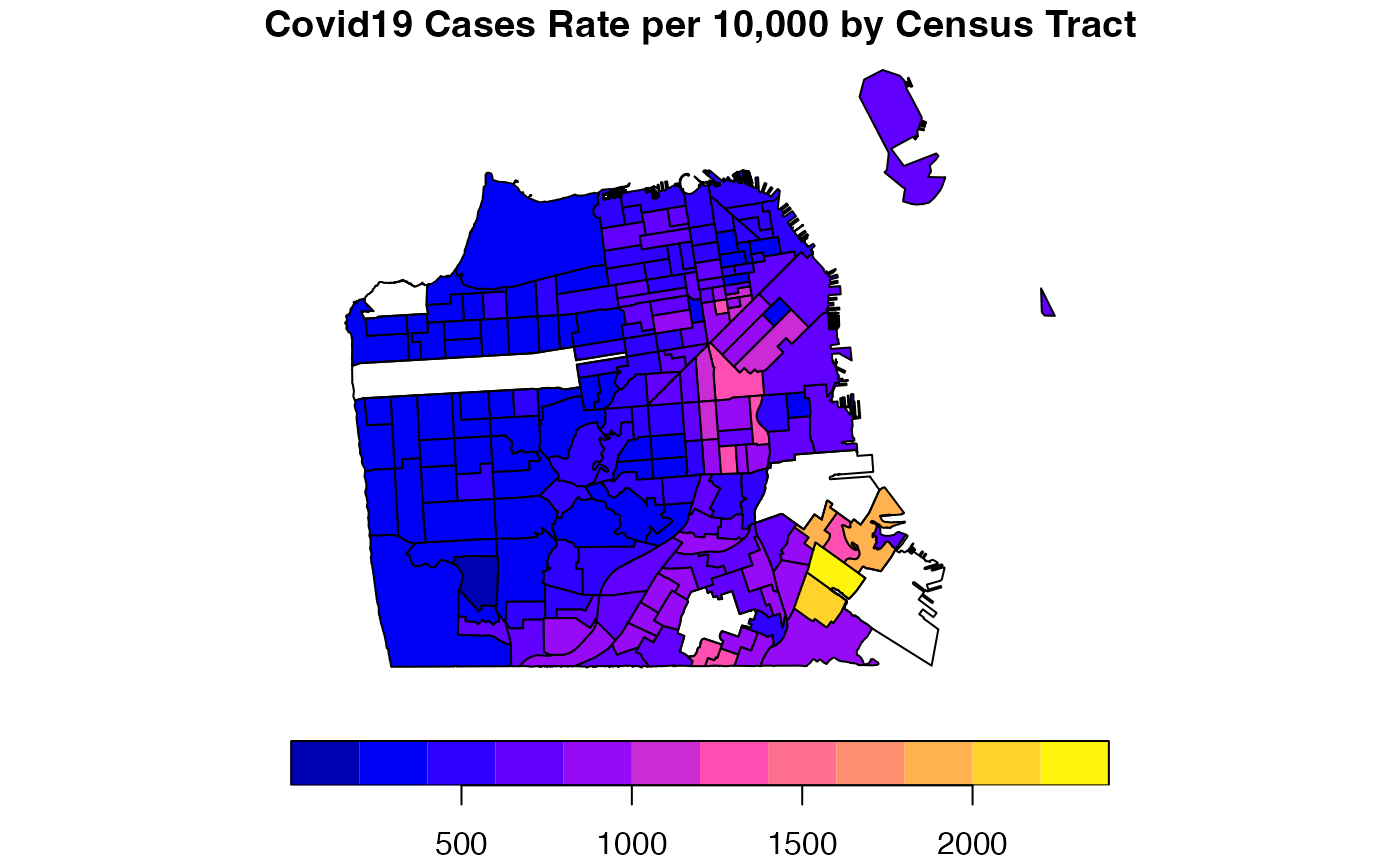
# Ploting SF Covid19 counts using base plot function
plot(covid19sf_geo[which(covid19sf_geo$area_type == "Census Tract"),
c("rate", "geometry")],
main = "Covid19 Cases Rate per 10,000 by Census Tract")