Deploying flexdashboard on Github Pages
One of Github’s coolest features is Github Pages, which enables you to create and deploy websites under github.com domain for free. The most common usage of Github Pages is the deployment of project documentation. The R community is widely using it to deploy different R Markdown formats such as package documentation with pkgdown, blogs with blogdown, books with bookdown, etc. Recently, as I was looking for a way to share Covid19 data, I had this eureka moment realizing that it should be straightforward to deploy flexdashboard or any other format of R Markdown (none Shiny) on Github Pages. After a short googling, I come across this example by Phil Batey. Since then, I started to utlized this feature in some of my packages (visualizing Covid19 datasets). Here are some use cases of such dashboards:
- The coronavirus dashboard, supporting the coronavirus package
- Covid19 Italy dashboard, supporting the covid19italy package
- US Wildfire dashboard, tracking the ongoing wildfire in the US
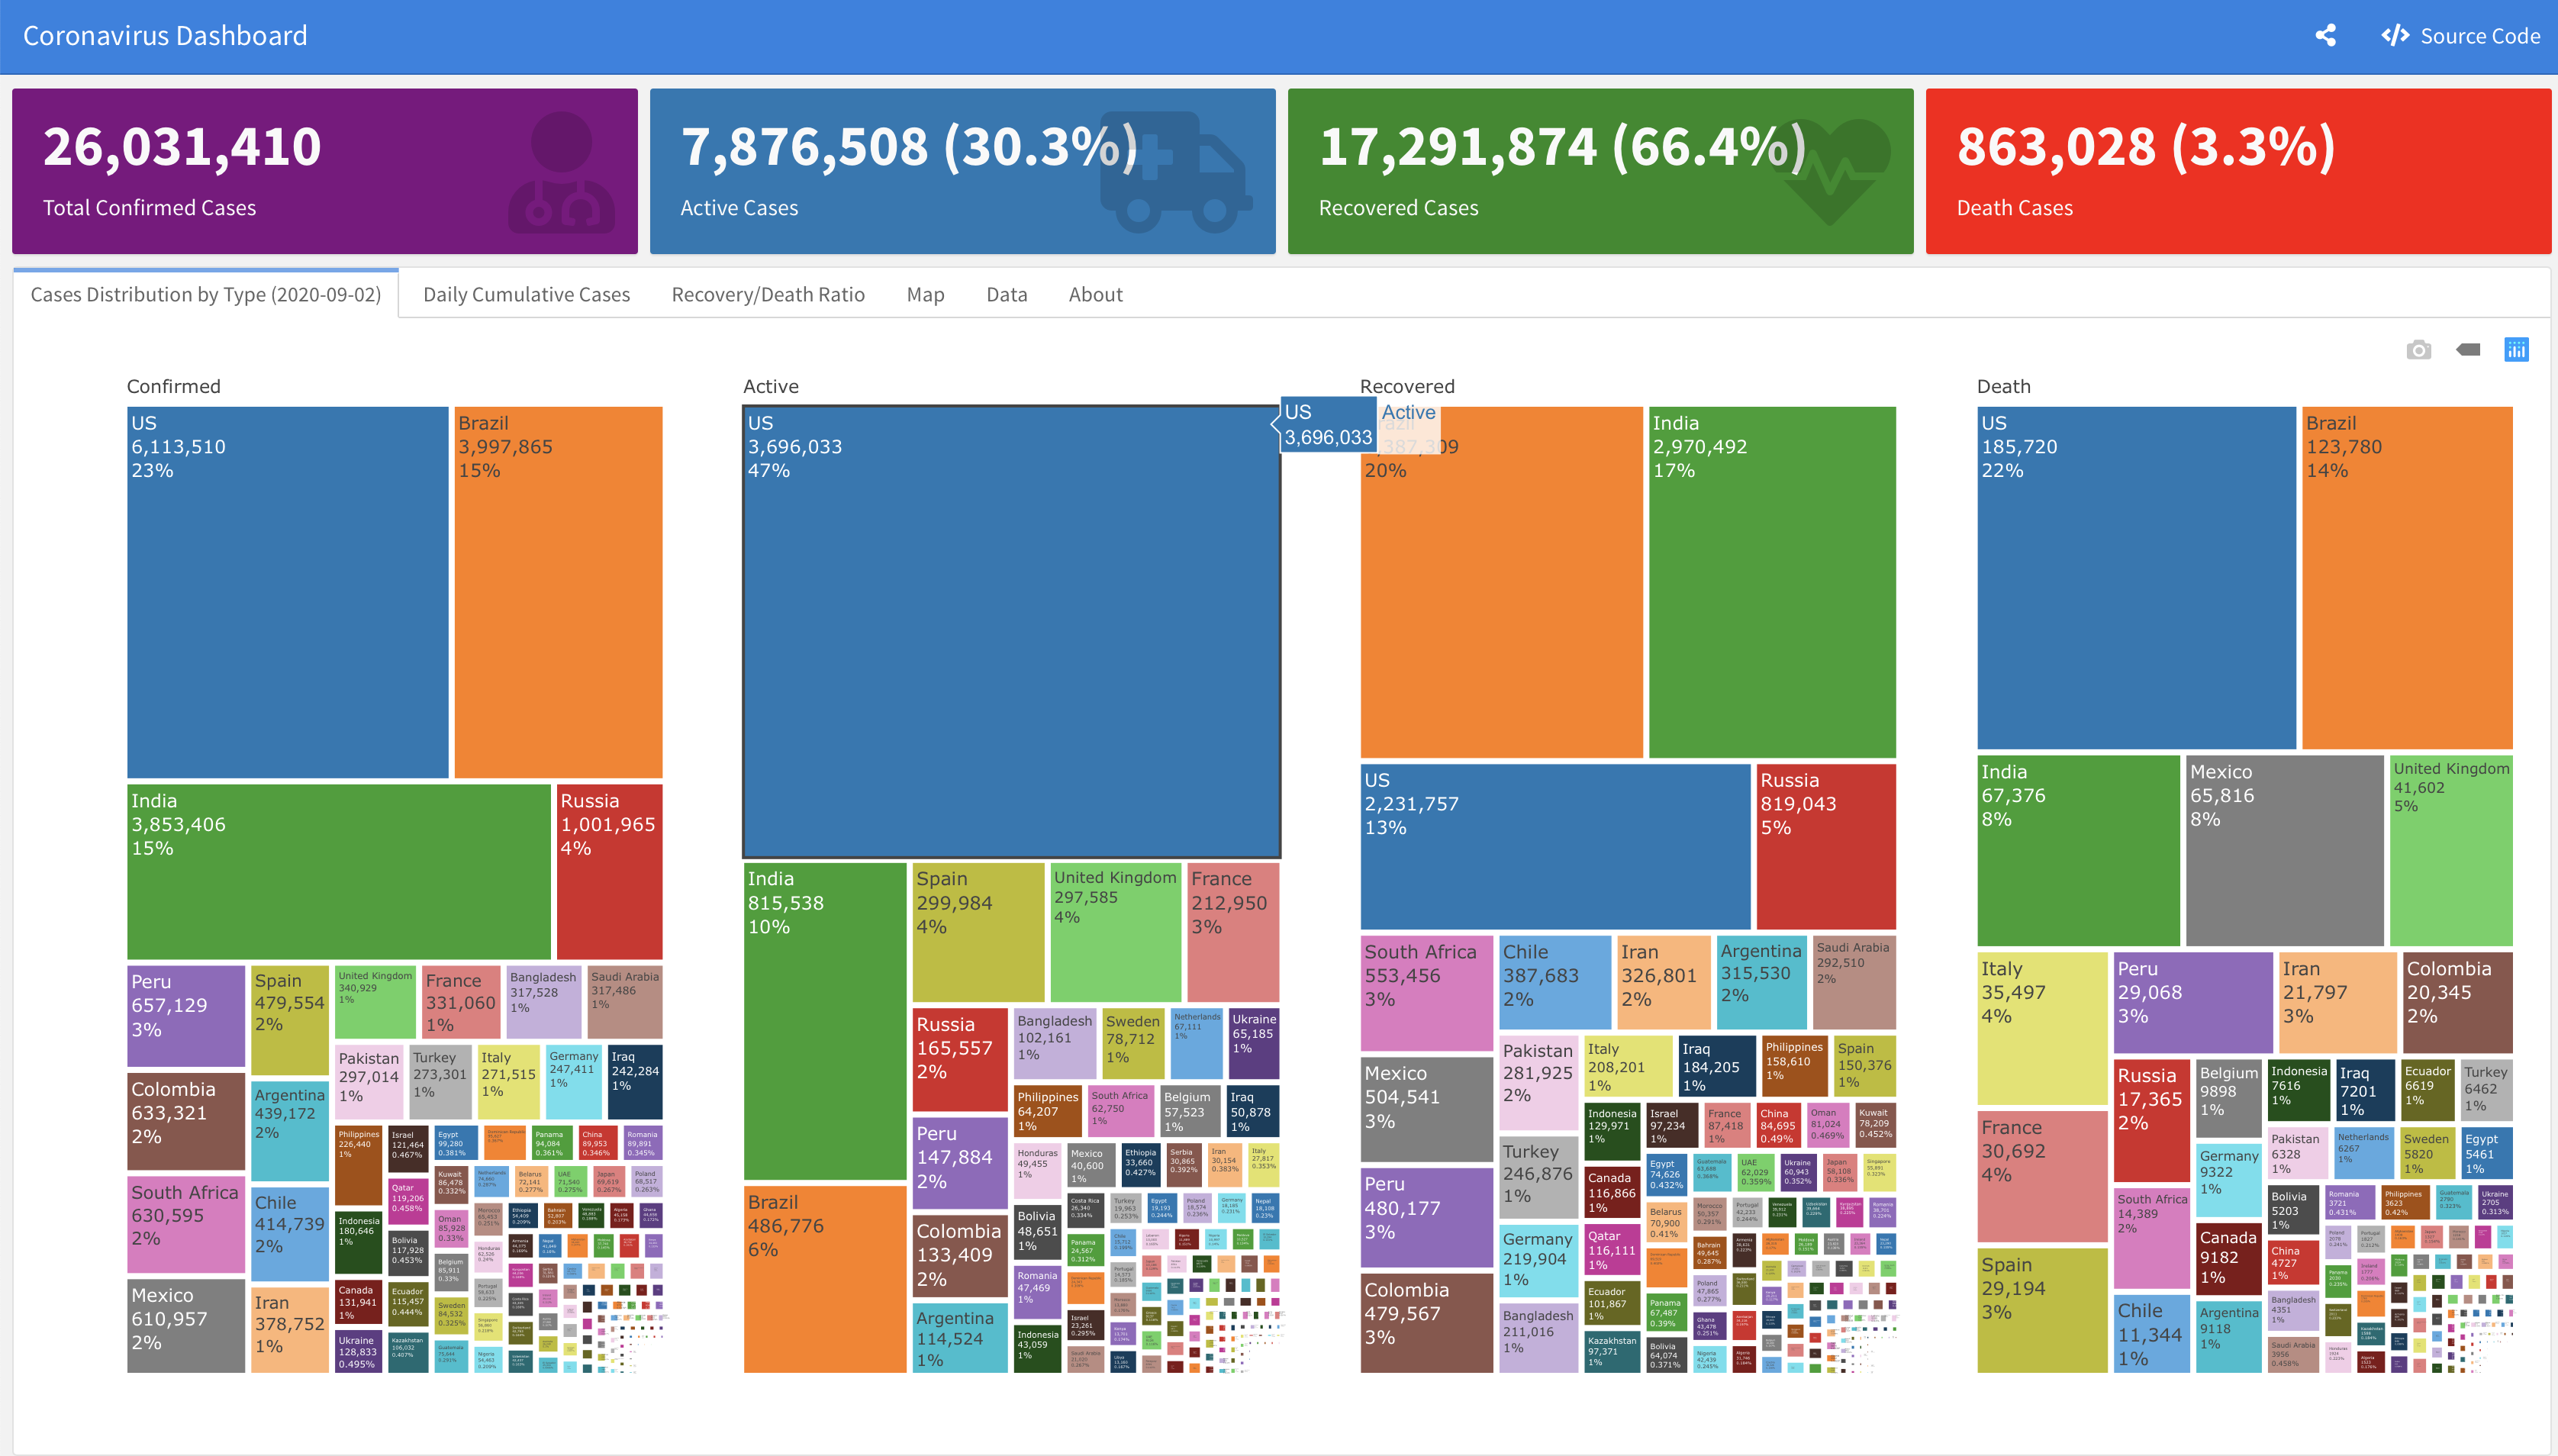
This post provides a short tutorial for deploying flexdashboard on Github Pages.
Flexdashboard on Github Pages
The flexdashboard package provides a customized format for building interactive dashboards. It is a simplistic, useful, and fast method for developing a static dashboard that does not require a big data or back-end server (although you can use flexdashboard with Shiny to create a dynamic dashboard with back-end server support). To deploy flexdashboard on Github Pages, you will need:
- Github repository
- flexdashboard and rmarkdown packages
- A flexdashboard file (i.e.,
Rmd) _site.ymlfile
Simple example
The following example demonstrates the deployment process of flexdashboard on Github Pages. We will start by creating a new repository for the deployment (can also deploy on an existing repository as well) using the Github web interface:

Note that the repository must be public to expose it on a Github page. We will set the name, keep all the checkboxes unchecked, and create the repository.
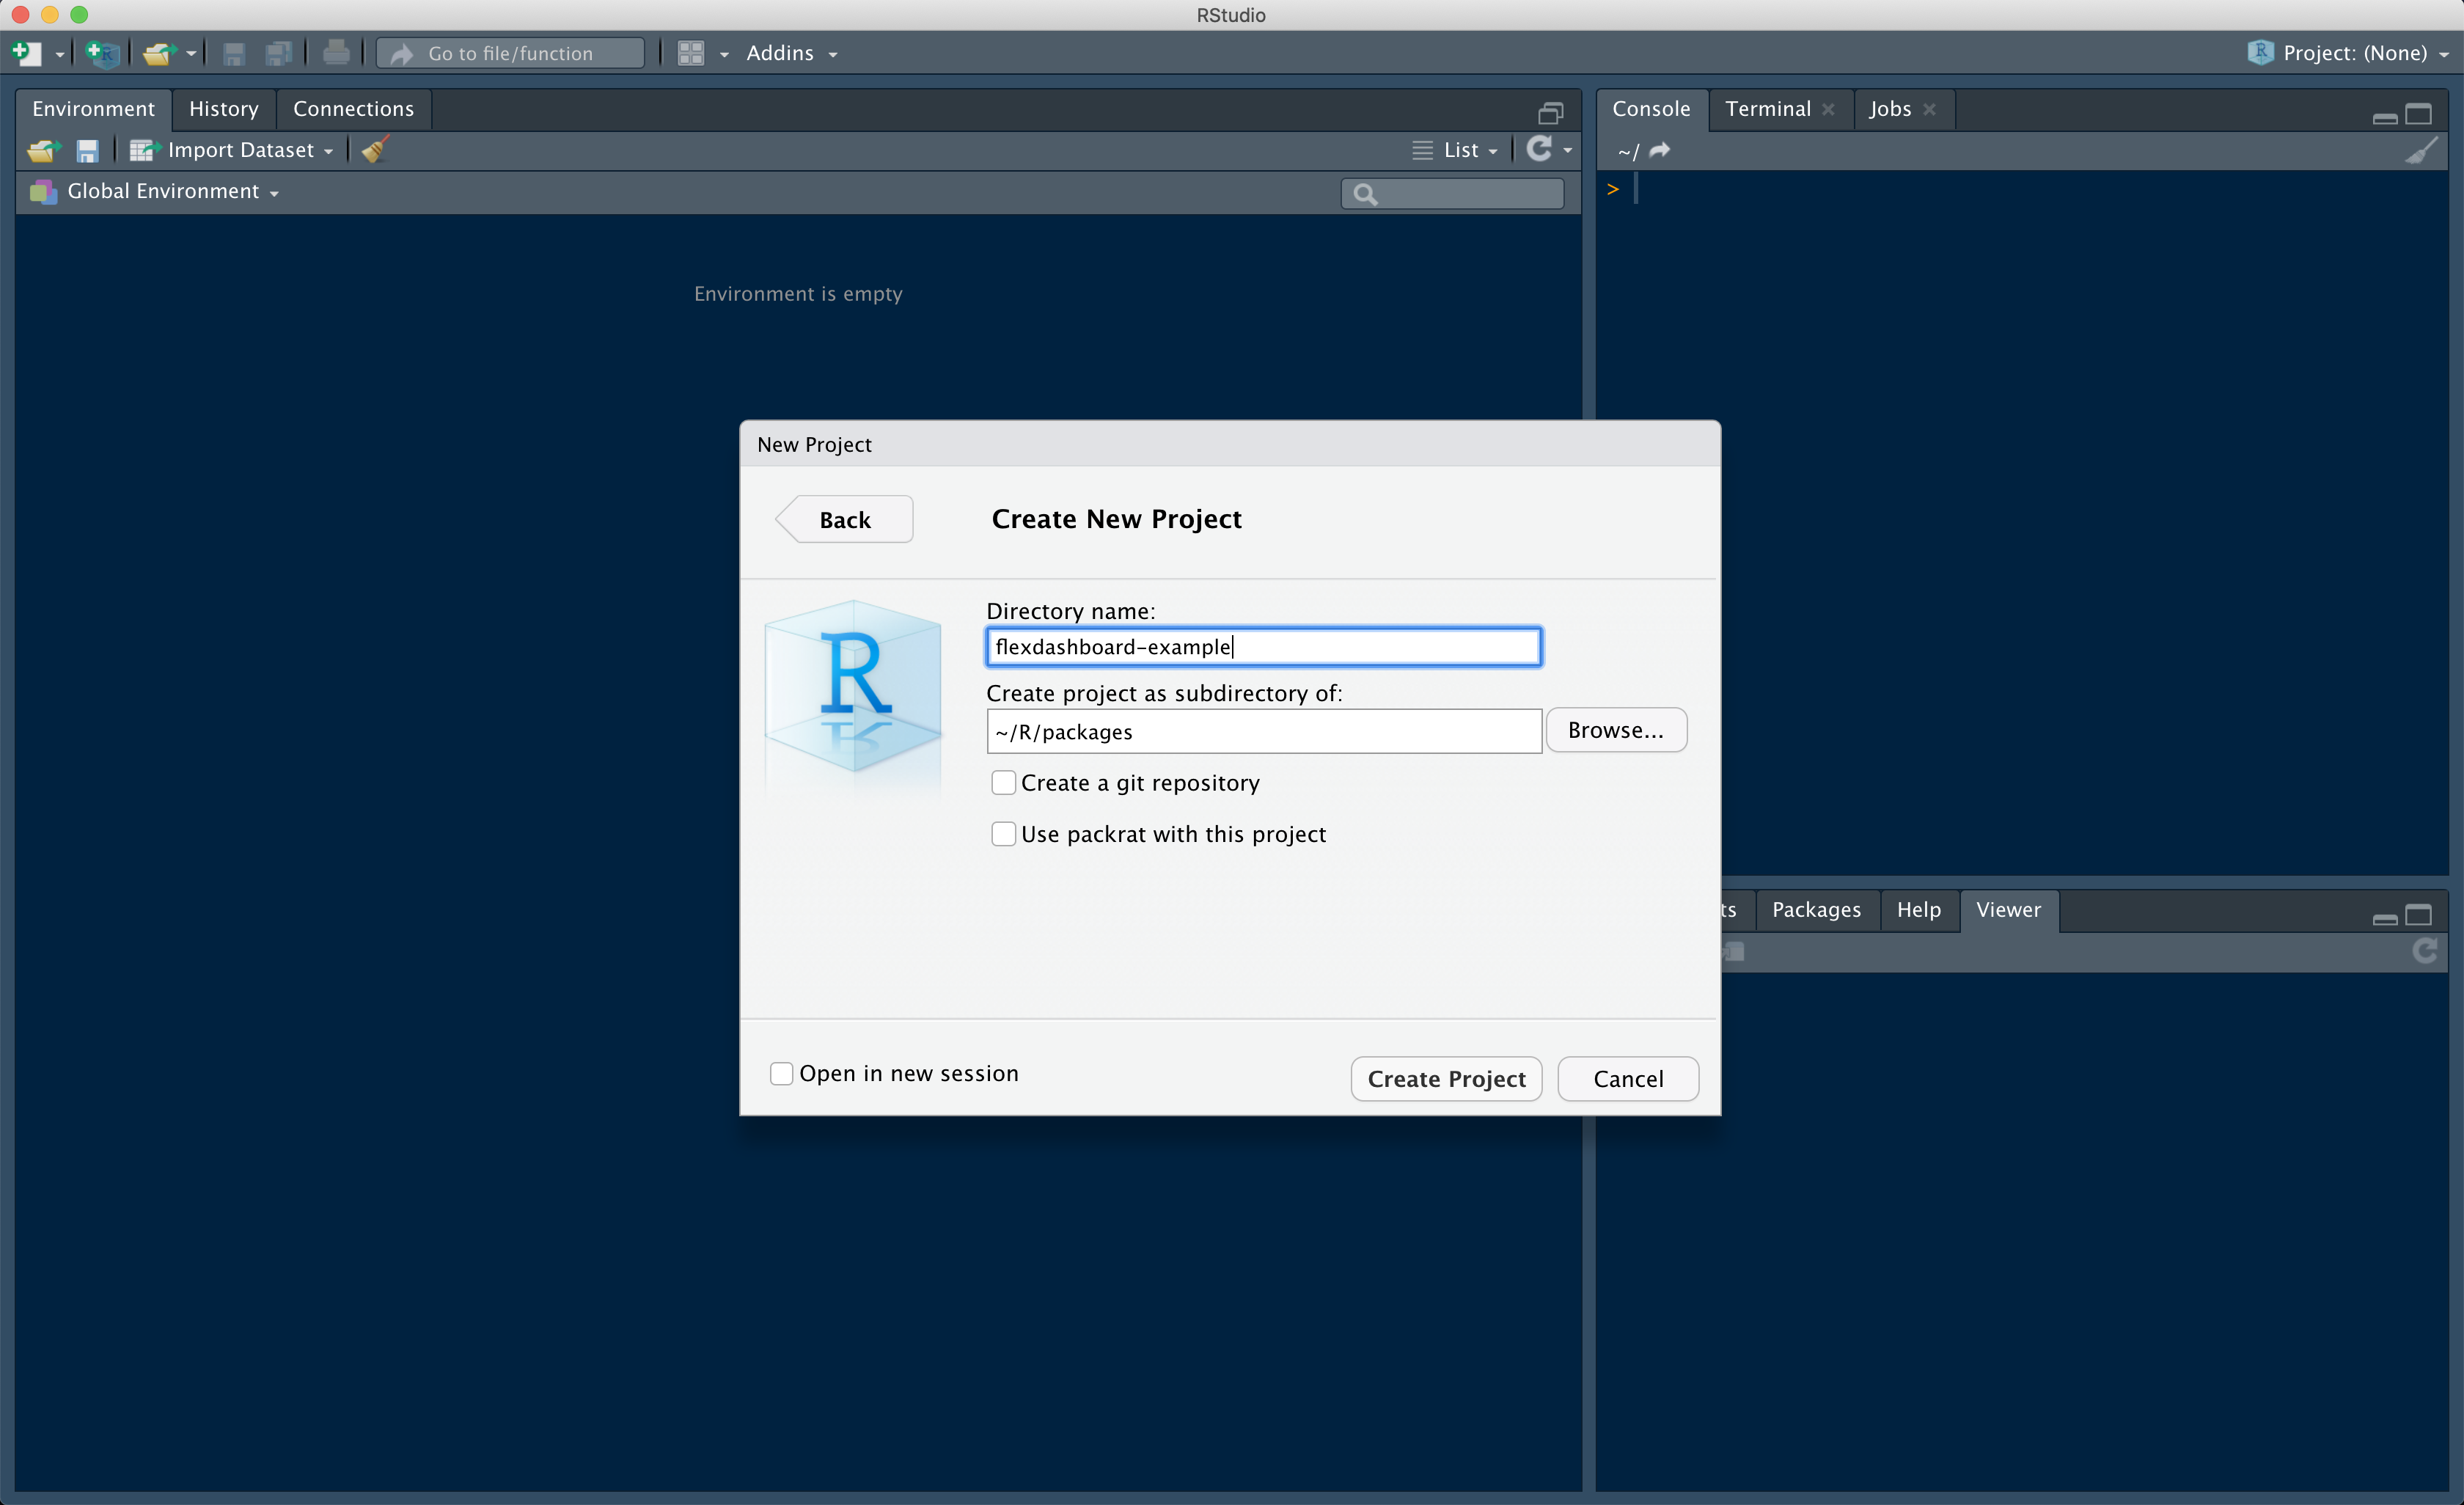
The next step is to create a local folder and sync it with the origin on Github. There are few methods for doing it, such as local file manager (e.g., Finder on Mac, File Explorer on Windows, etc.), terminal (or command line), RStudio, etc. For simplicity, I will use here RStudio by creating new project by following those steps:
- Clicking the
Project:drop-down button on the top right (see the blue rectangle on the first screenshot) - Select the
New Project…option - Select the first option,
New Directory, on theNew Projectwindow (screenshot below)

- Set the folder path and name, leave the checkboxes unchecked, and click the
create projectbutton
Before we sync the new folder with the origin on Github, let’s create the dashboard. We will start by creating the _site.yml file. The _site.yml is a setting file that enables us to configure the R Markdown file’s rendering options. Creating this file can be done by clicking on the top left menu File -> New File -> Text File, which will pop-up a new file on the source pane, and we will save it as _site.yml. As typically, Github pages is rendering the website from the docs folder, we will set the R Markdown HTML output to the docs folder. Paste the following code and save it:
name: "flexdashboard-example"
output_dir: docs
More details about the _site.yml file available here.
Next, we will use the built-in flexdashboard template by selecting on Rstudio on the top left options File -> New File -> R Markdown. The New R Markdown window should pop-up, select the From Template option on the left, and then choose the Flex Dashboard template. Note that you probably won’t have this template available on this template menu if the flexdashboard package is not installed.

Once creating the template, a new file will pop-up on the source pane named Untitled1 (or Untitiledn if more n-1 un-named files are already opened). To run the dashboard as a website, we will name the file as index.Rmd (saving it on RStudio as index will automatically name it as index.Rmd), which will render it into index.html file. By default, the dashboard template comes with a layout of two empty columns (where the second column splitted into two raws). For making this example more appealing, I will drop three interactive plots from the Plotly package documentation.
Now we are ready to render the dashboard! Click on the Knit option (under the file name tab on the source pane), and this is the output you should expect (just without the plots which I added for the example):
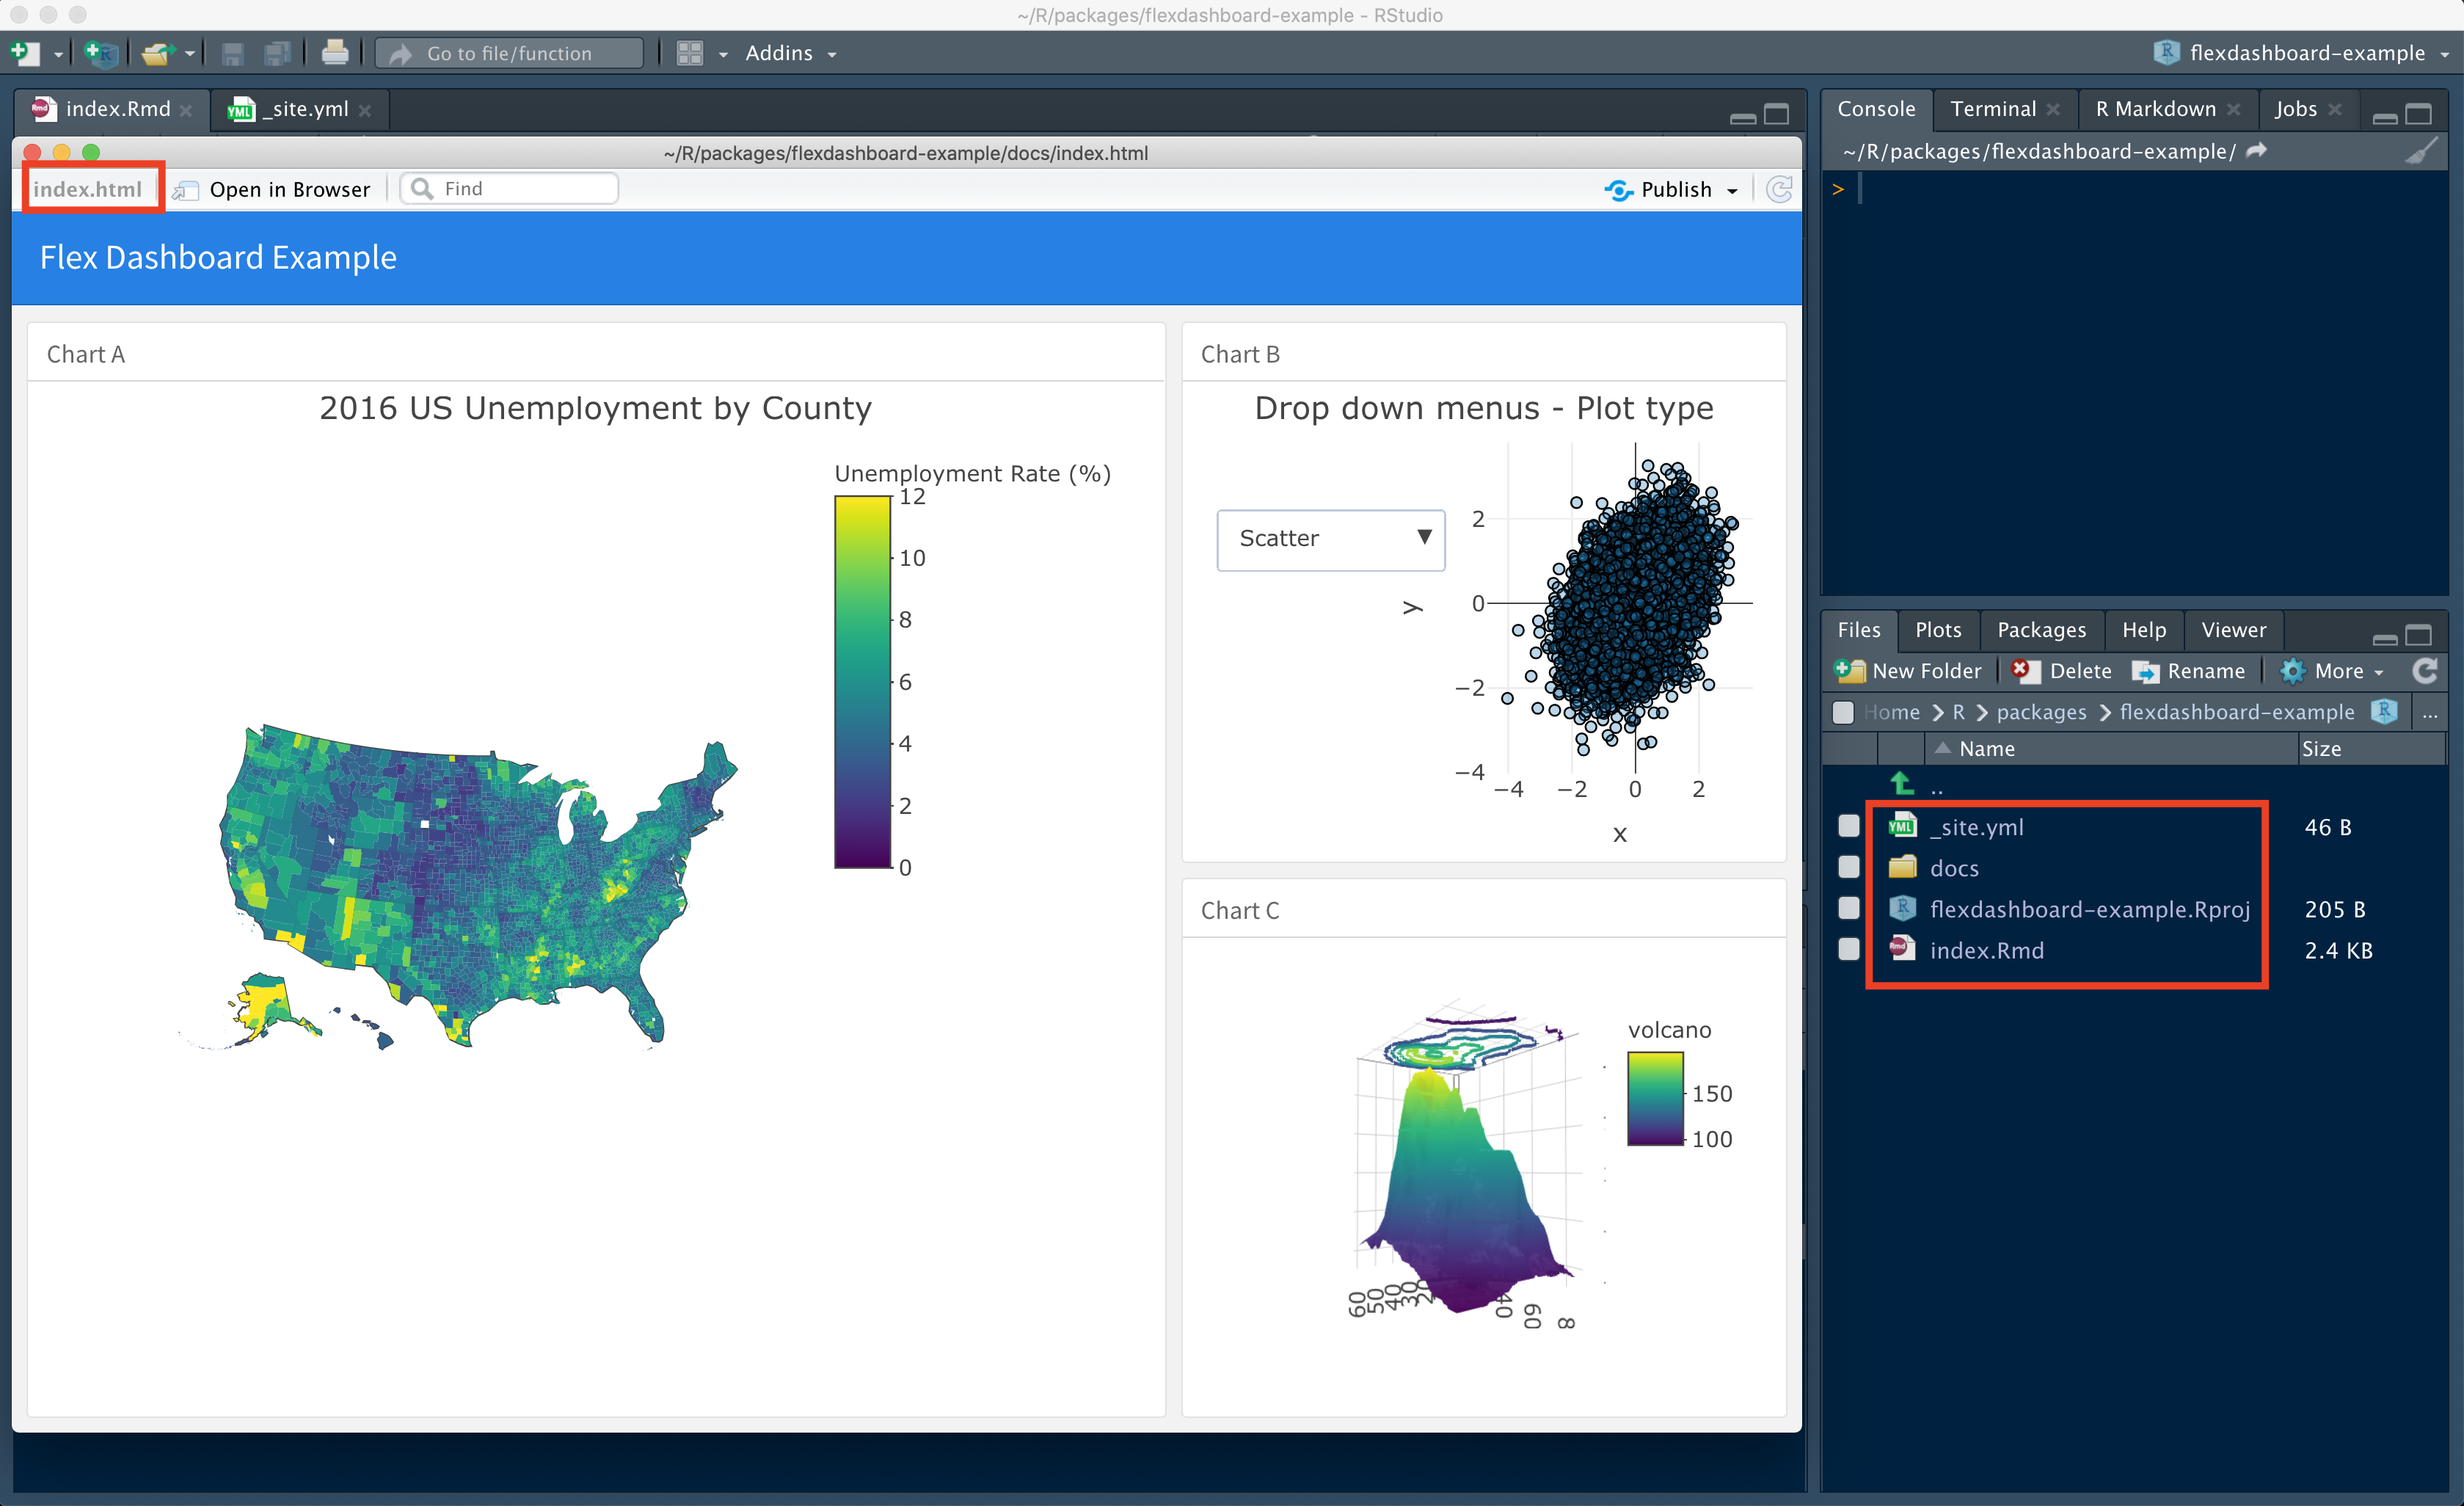
You can noticed on the screenshot above that the dashboard file name (on the dashboard top right) is index.html. In addition, the HTML output was rendered automatically into the docs folder (see the folder on the buttom right of the screenshot) as we set on the _site.yml file before.
The last step of the deployment is to sync the local repo with the origin and set the website. To set the git you can use the repository details from Github to linked it with the local folder:
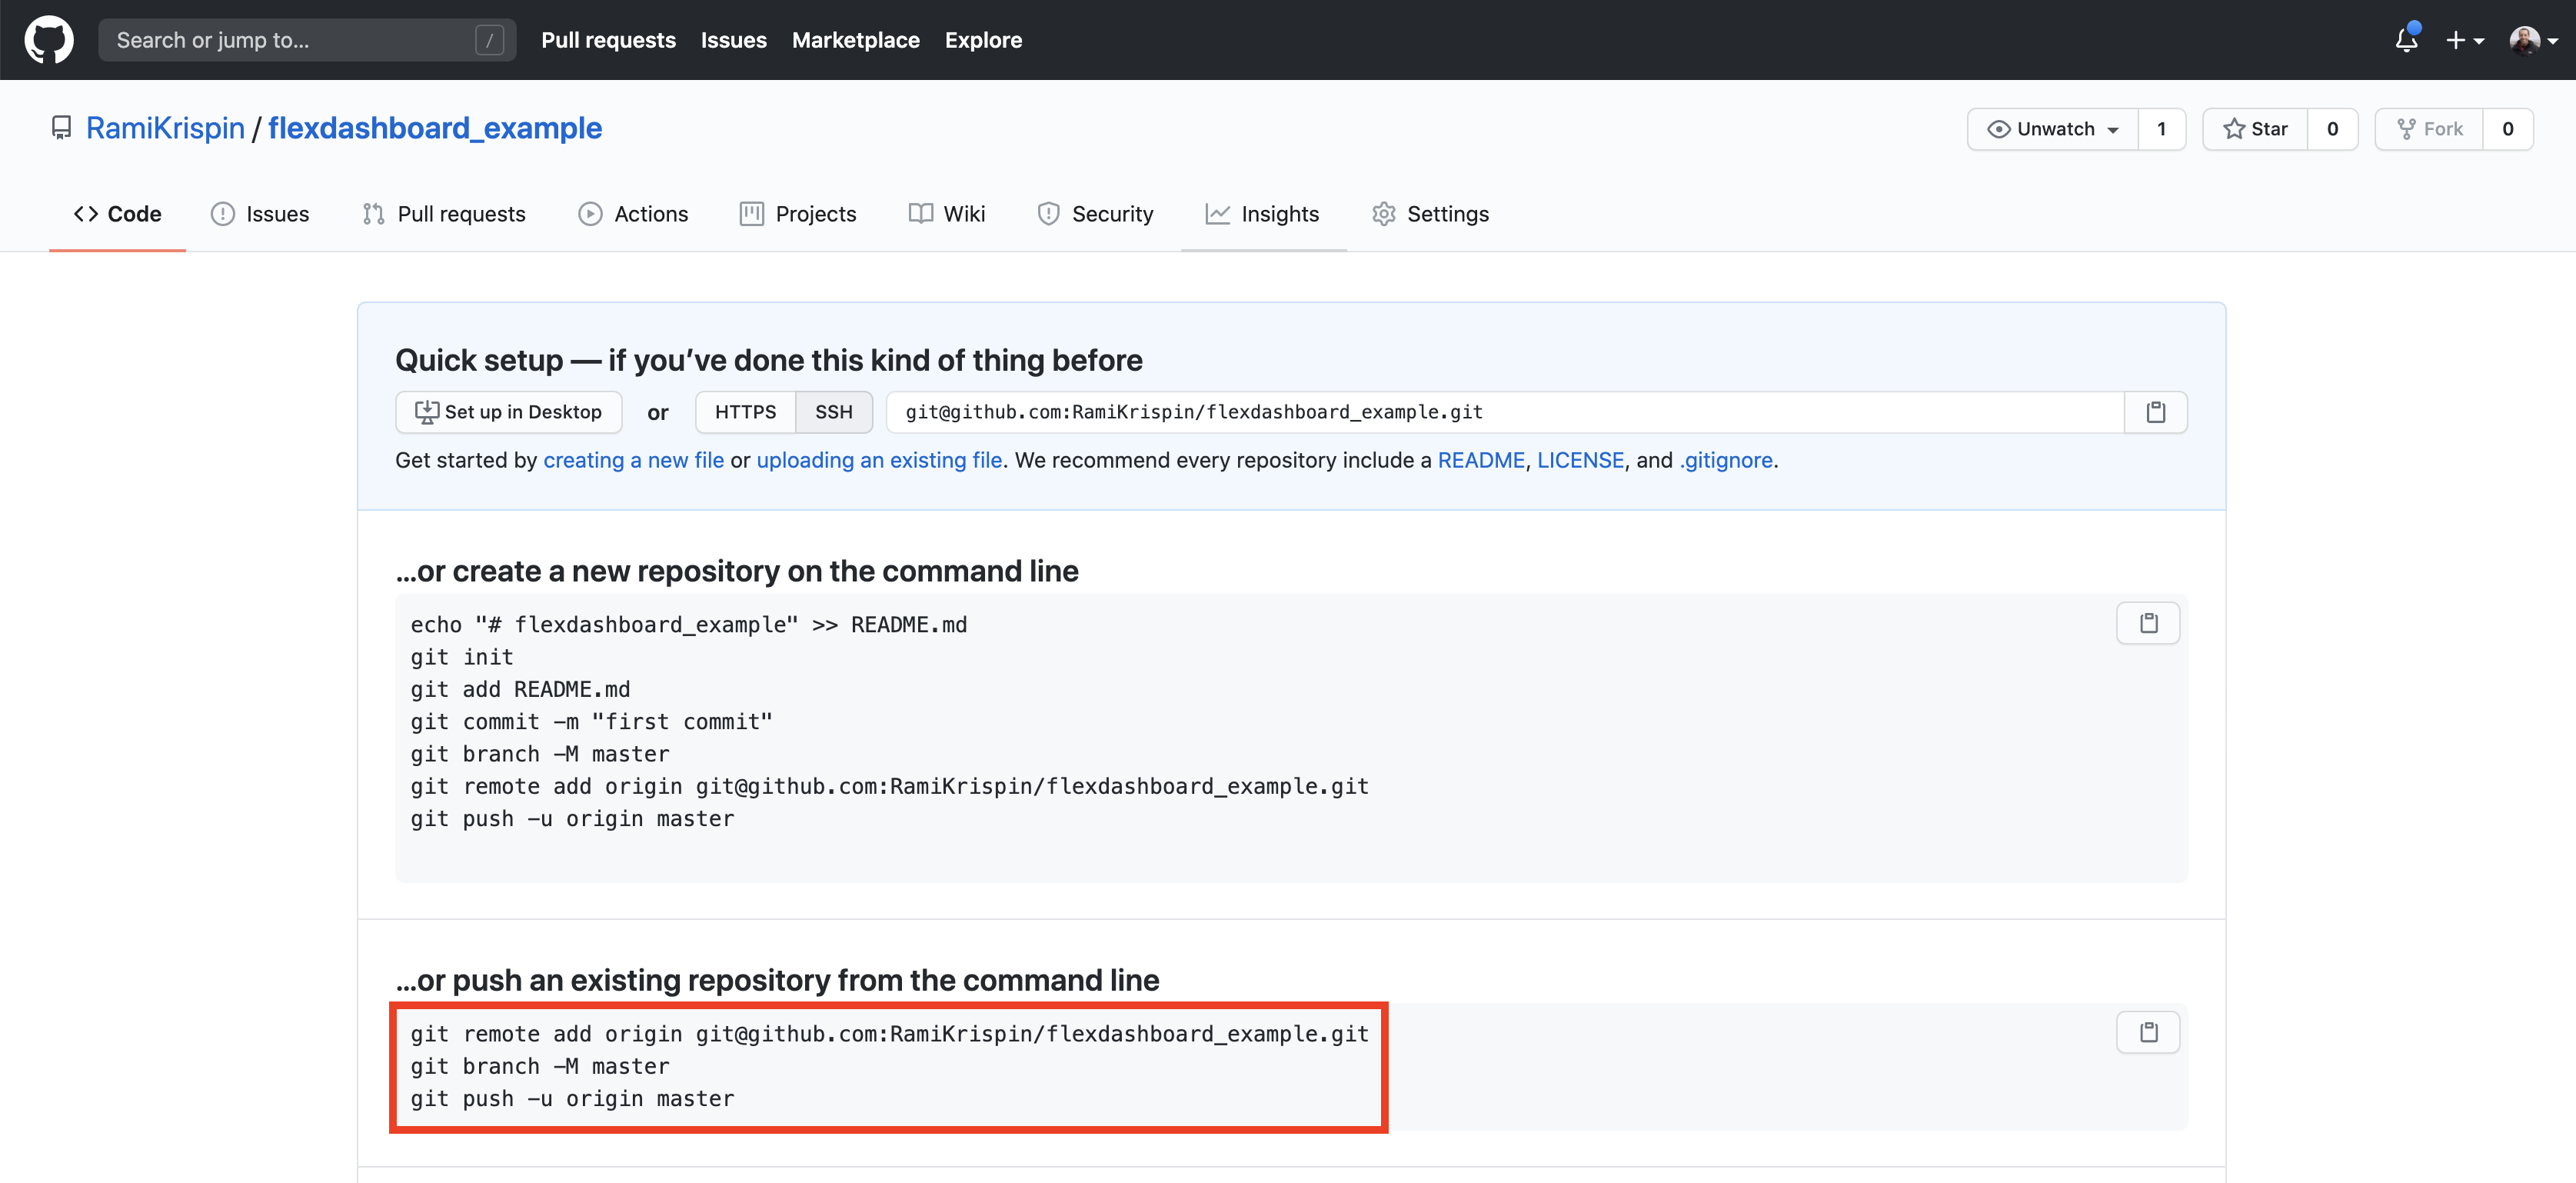
We will init a git work space on the local folder we created for the project, and commit the folder content by using the origin address from the red box above:
git init
git add *
git commit -m "init commit"
git remote add origin git@github.com:RamiKrispin/flexdashboard_example.git
git push -u origin master
Now, if all went well, you should see the content of the local folder on the Github repository. The last step would be to set the Github Page. Go to the repository settings -> options -> Github Pages and set the page source by selecting the master branch and the docs folder, and save the changes. Once saved, you should get the deployed Github Page URL on top:
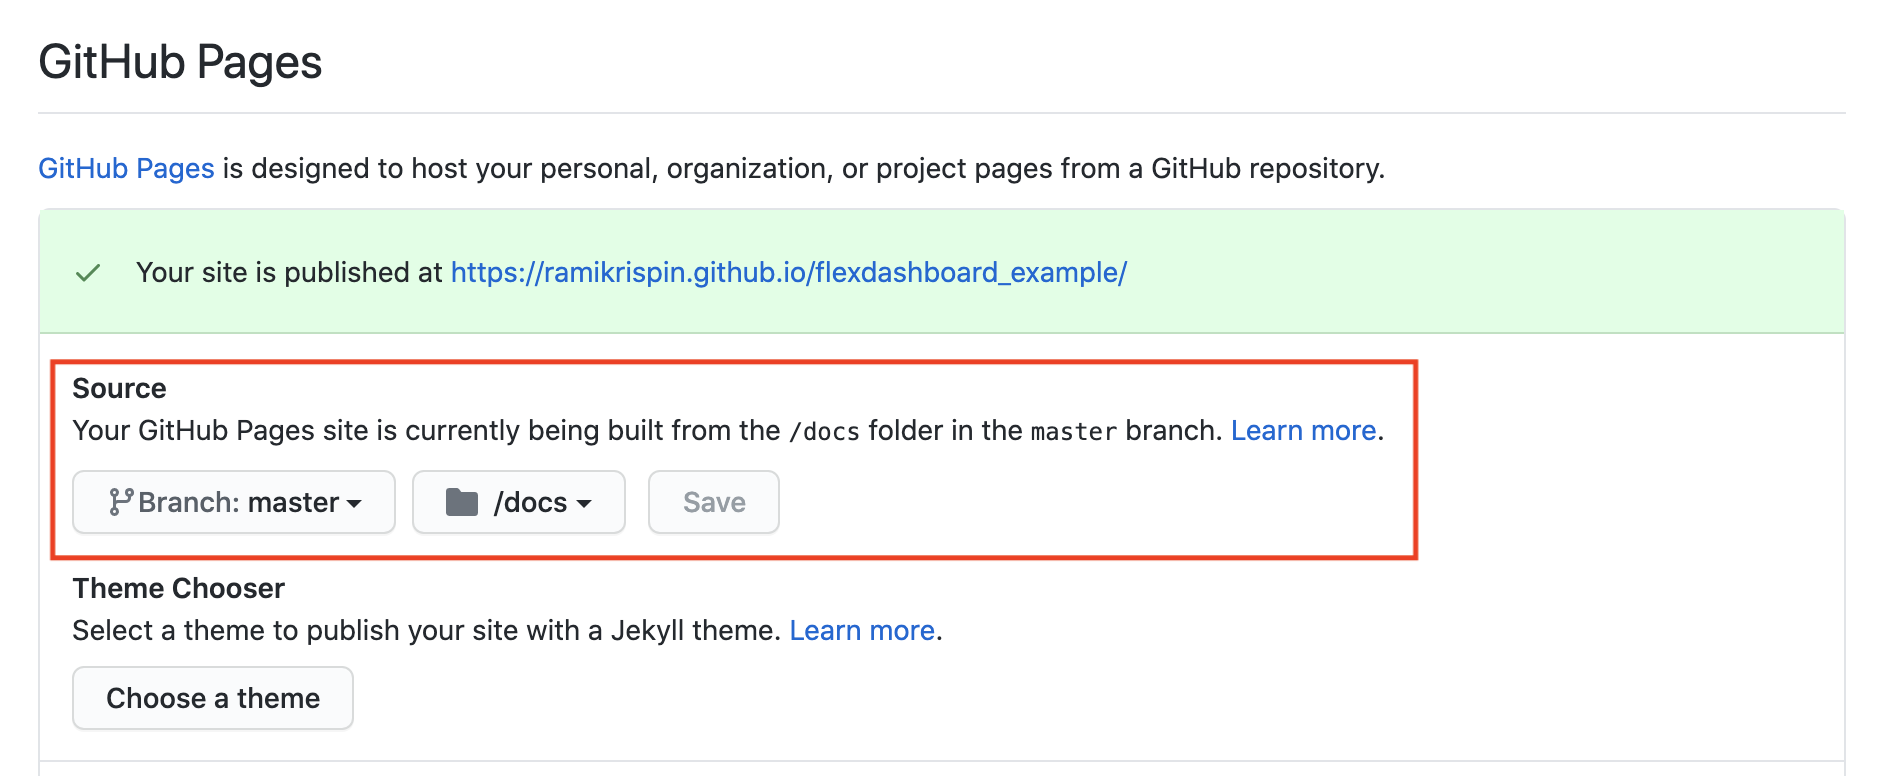
And… it deployed!
https://ramikrispin.github.io/flexdashboard_example/

Note that the page URL is a combination of https://Your_Github_User_Name.github.io/Repository_Name/
Resources
Here are some useful resources for deploying flexdashboard on Github Pages:
- Deployment code - https://github.com/RamiKrispin/flexdashboard_example
- Flexdashboard - https://rmarkdown.rstudio.com/flexdashboard/
- R Markdown: The Definitive Guide - https://bookdown.org/yihui/rmarkdown/, and in particular chapter 10.5 for setting the
_site.ymlfile - Github Pages - https://pages.github.com/